
Simple Plot
Creating a Plot
To plot the vector (1,2,10,0,4,5,1,1) of points, in the command window, type the following code:
> x=c(1,2,10,0,4,5,1,1)             # create the vector first by typing
> plot(x)                                      # Use the command plot

Click to view
Adding a title:
> Plot(x, main="Simple plot")

Click to view
Changing the x and y labels:
> plot(x, xlab="x",ylab="y",main=""Simple plot"")

Click to view
Plotting a Line
> Create points on the interval [0,10] equally spaced by 0.01.
>x=seq(0,10,0.01)

># Create the corresponding values of y
> y=x^2

>Plot y versus x
>plot(x,y, main="Square root function")

Click to view
Overlaying the graph of the function y = x2
> #Create a vector z containing the values of x2
> z=x^2
> Adding the graph of z=x2  with  red color
> lines(x,z,col="red")
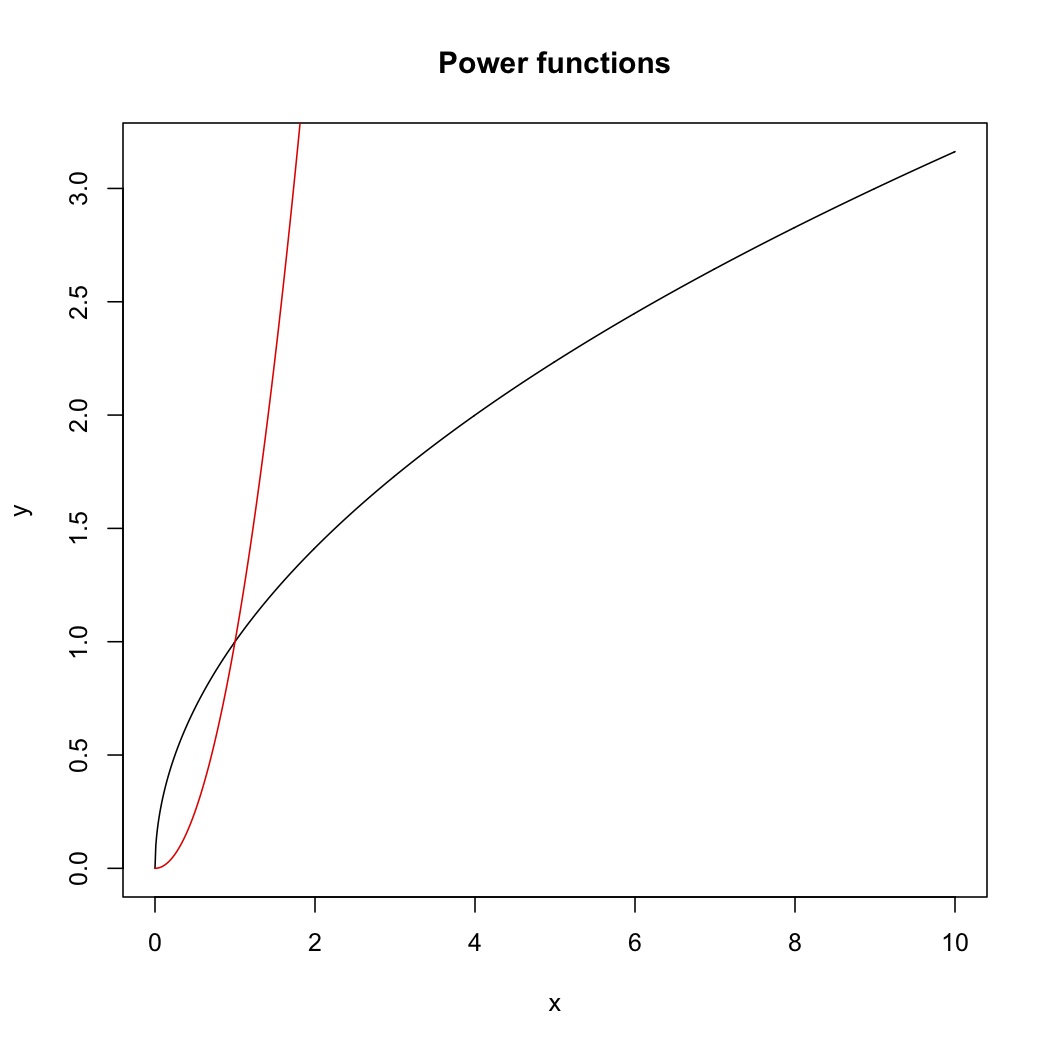
Click to view
Adding a legend
>legend(7, 1.5, c("Square root","Square"),fil=c("black","red"),title="Type of function")
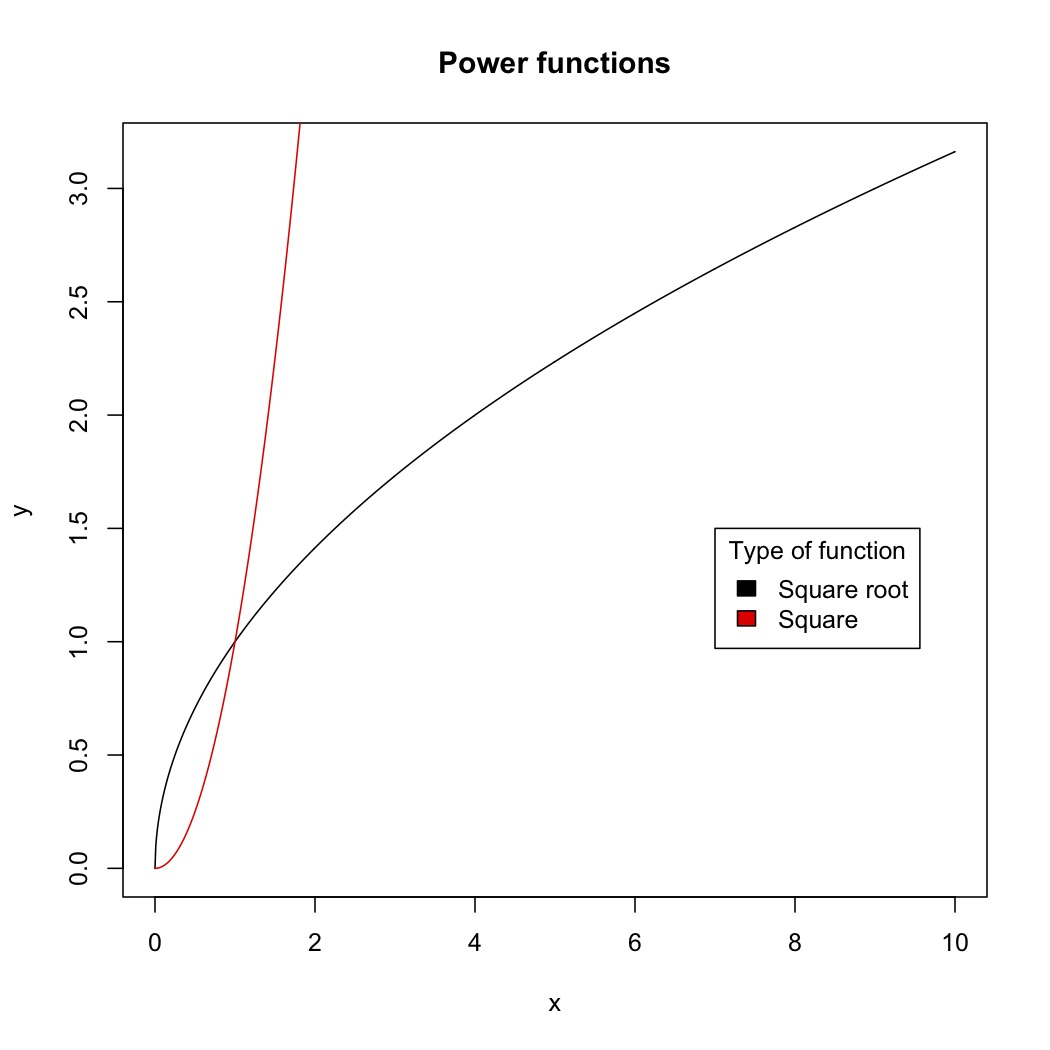
Click to view