
Box Plot
Simple Boxplot:
A simple boxplot can be obtained with R, using the command "boxplot" is the "base" package.
>crickets<-read.table(file="http://ramanujan.math.trinity.edu/ekwessi/misc/crickets.txt",header=T)
       # Loading the dataset "crickets" into the R-workspace
>boxplot(crickets$Temperature,col="yellow",ylab=Temperature, main="Boxplot of Temperature")
      # Obtaining the boxplot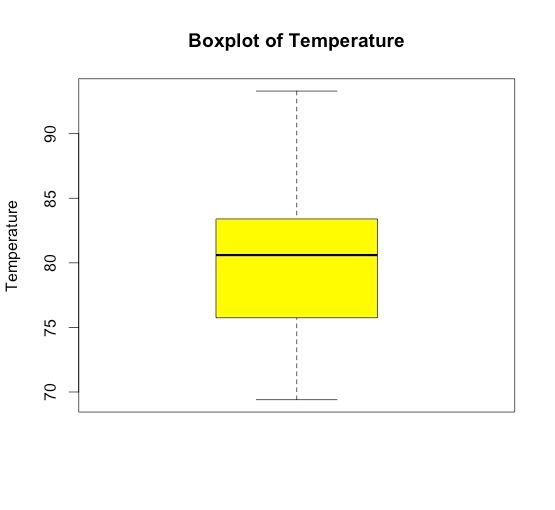
Click to view
Multiple (Comparative) Boxplots
The command "boxplot" can also be used to obtain a multiple (or comparative) boxplots.
>cuckoo<-read.table(file="http://ramanujan.math.trinity.edu/ekwessi/misc/cuckoo.txt",header=T)
>boxplot(cuckoo$Length~cuckoo$Species, col=c("green","red","yellow"),xlab="Species",
ylab="Length of Cuckoo's eggs", main="Comparative boxplots of eggs' Lengths")

Click to view
Note that you could also obtain the same plot with the command "plot", but this would work in general if the data are already well sorted as the ones in the file "cuckoo.txt"