
Pie Chart
Pie Charts can be obtained from R using the command "pie".
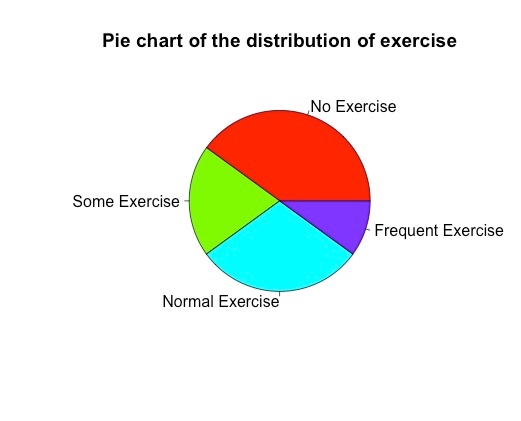
>Exercise.Percentage=c(40,20,30,10)
>names(Exercise.Percentage)=c("No Exercise","Some Exercise","Normal Exercise","Frequent Exercise")
>pie(Exercise.Percentage,col=rainbow(4),main="Pie chart of the distribution of exercise")
Click to view
Going Further:
Check with help(pie) all the options of the command "pie"