Data Description
The female Cuckoo lays her eggs in other birds' nests. The "foster parents" are usually deceived, probably because of the similarity in sizes of their own eggs.
We would like to use ANOVA to find out if there is any significant difference between the means of the lengths of Cuckoo's eggs found in the nests of these three species.
The response variable here "Length" and the Factor is "Species" and the Treatments or Levels are Hedge sparrow, Robin, Wren.
Analysis
>cuckoo<-read.table(file="http://ramanujan.math.trinity.edu/ekwessi/misc/cuckoo.txt",header=T)   # Loading the data set into the R-workspace
> head(cuckoo)                                                                                   # Observing the first 6 data points
Species Length
1 HedgeSparrow 22.0
2 HedgeSparrow 23.0
3 HedgeSparrow 20.9
4 HedgeSparrow 23.8
5 HedgeSparrow 25.0
6 HedgeSparrow 24.0
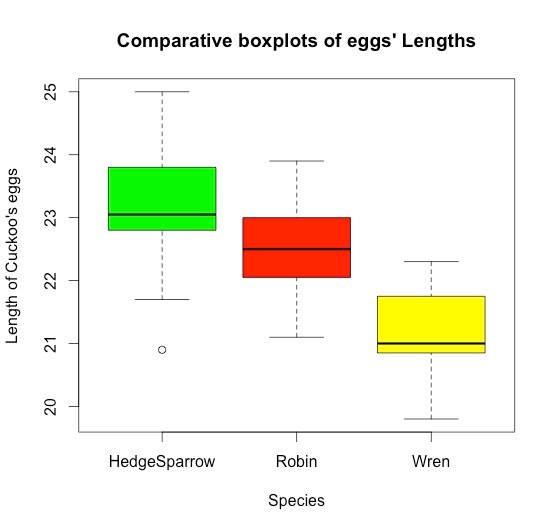
>boxplot(cuckoo$Length~cuckoo$Species, col=c("green","red","yellow"),xlab="Species",
ylab="Length of Cuckoo's eggs", ,main="Comparative boxplots")  # Boxplot to have a first glance of the mean differences.
>anova=aov(Length~Species, data=cuckoo)           # Performing anova
>summary(anova)                                   # Summary of the results, with SS of type I
Df Sum Sq Mean Sq F value Pr(>F)
Species 2 29.6 14.799 21.73 3.31e-07 ***
Residuals 42 28.6 0.681
---
Signif. codes: 0 ‘***’ 0.001 ‘**’ 0.01 ‘*’ 0.05 ‘.’ 0.1 ‘ ’ 1
>drop1(anova,~.,test="F") # Displaying SS of type III as in SAS and SPSS
Single term deletions
Model:
Length ~ Species
Df Sum of Sq RSS AIC F value Pr(>F)
<none> 28.598 -14.399
Species 2 29.598 58.196 13.572 21.734 3.314e-07 ***
---
Signif. codes: 0 ‘***’ 0.001 ‘**’ 0.01 ‘*’ 0.05 ‘.’ 0.1 ‘ ’ 1
Post-Hoc Analysis
>TukeyHSD(anova) # Pairwise Comparison using Tukey Honestly Significant Difference (HSD)
Tukey multiple comparisons of means
95% family-wise confidence level
Fit: aov(formula = Length ~ Species, data = cuckoo)
$Species
diff lwr upr p adj
Robin-HedgeSparrow -0.49375 -1.227416 0.2399161 0.2424181
Wren-HedgeSparrow -1.93000 -2.674991 - 1.1850087 0.0000004
Wren-Robin -1.43625 -2.156755 -0.7157449 0.0000518
Interpretation of the results:
1. The Boxplot shows that the mean length of Cuckoo's eggs differs from species nets to species nets.
2. The P-value (3.31e-07) of the overall Anova is very small, which means that there the null hypothesis that the mean lengths of cuckoo's eggs are the equal is not plausible.
This also means that the alternative hypothesis that there are at least two mean lengths that are different is very plausible, but does not mention which one.
3. The Tukey HSD pairwise comparison shows there is a significant difference between the lengths of cuckoo's eggs found in the nest of Robin and Wren, and in the nest of Hedge Sparrow and Wren.
On the other hand, there is no statistically significant difference between the lengths of cukoo's eggs found in the nests of Hedge Sparrow and Robin, which confirms the impression given by the boxplot.
Remarks
1.There are other pairwise comparison methods available like the Fisher's Least Significant Difference (LSD) method, and the Bonferroni method, etc.
2. The Tukey method is more suitable here because it is specifically designed for multiple comparisons of means of normal populations.
3. Before deciding on the validity of the results, it worth checking is the assumptions are met.
Checking Assumptions
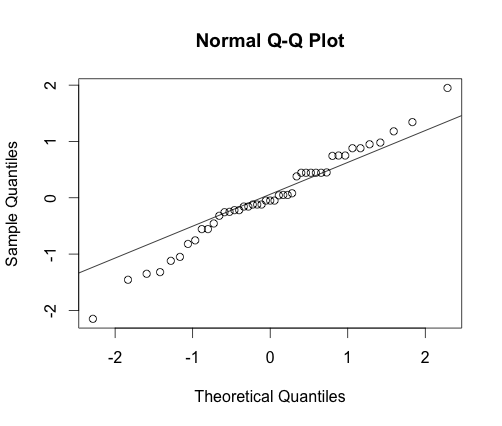
1. Normality: In practice, it better to check if the residuals of Anova are normally distributed.
> res<-anova$res       # Obtaining the residuals
> qqnorm(res)          # QQ plot
>qqline(res)           # Adding a line
It is clear from this plot that the normality assumption is not gravely violated since not many points do not follow closely the line.
More over, the Anderson darling test also confirms it (P-value=0.3375)
>ad.test(res)
Anderson-Darling normality test
data: res
A = 0.406, p-value = 0.3375
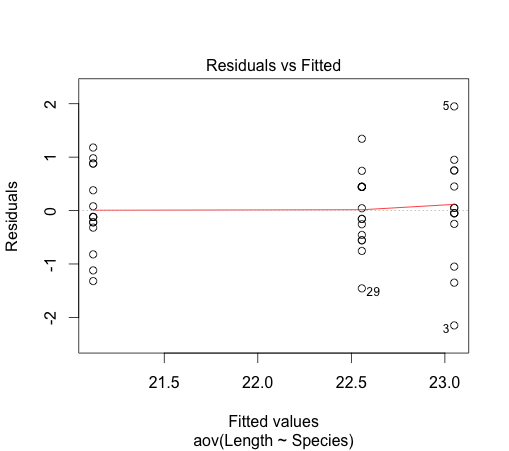
2. Equal variance: This assumption can be verified by looking at the plot of the residuals versus fitted values
This assumption appears not to be gravely violated.
Conclusion:
It is good practice to redo Anova procedures using nonparametric approaches (in this case, the Kruskal-Wallis Test shows that the pairwise comparisons results are preserved) when assumptions seems to have been violated.
If similar results are found using nonparametric procedures, then the violations might have had just a minor effect on the overall results of parametric Anovas.


